Tachycardia DDx
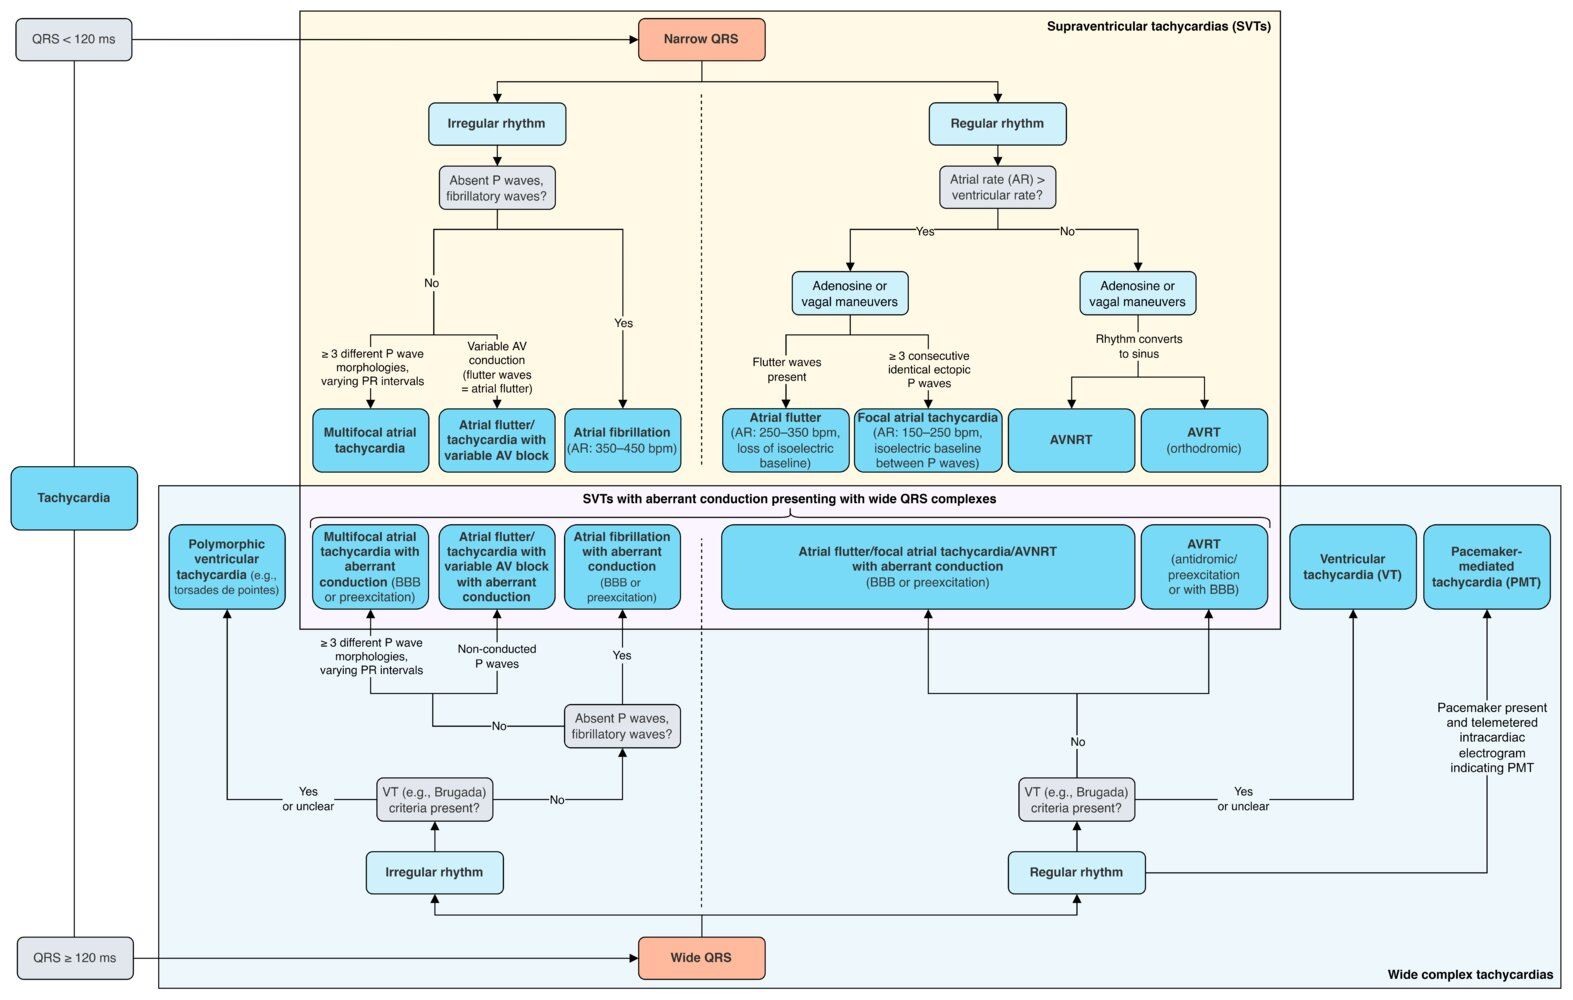 The differential diagnosis of a regular narrow tachycardia in general includes 5 major mechanisms:
- Sinus tachycardia
- AVNRT
- Atrial tachycardia
- Orthodromic atrio-ventricular reentrant tachycardia (AVRT) involving retrograde conduction over a “concealed” bypass tract
- Atrial flutter with 2:1 block
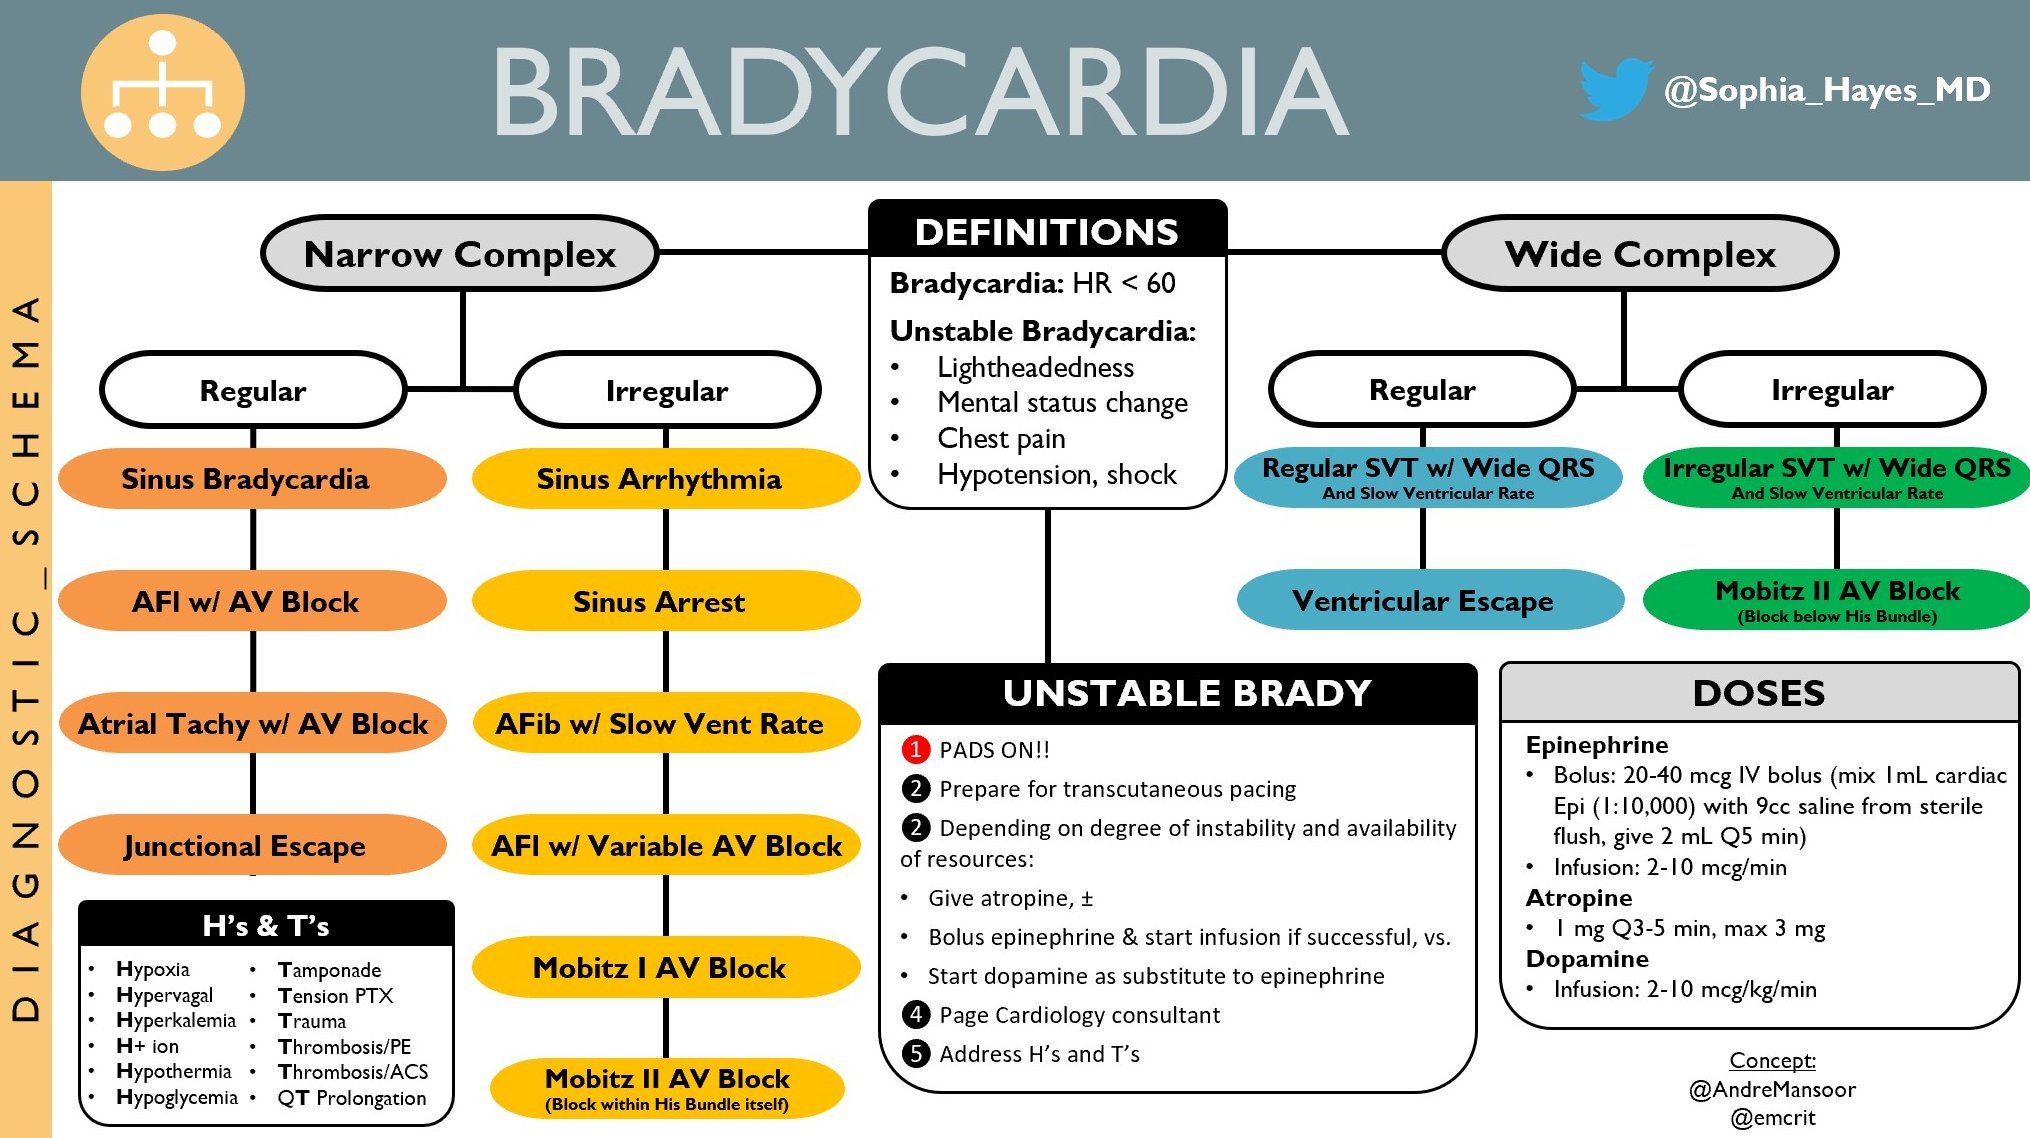
Bradycardia DDx
Whenever you see a negative P wave and QRS complex in lead I the likely diagnosis is limb lead reversal.
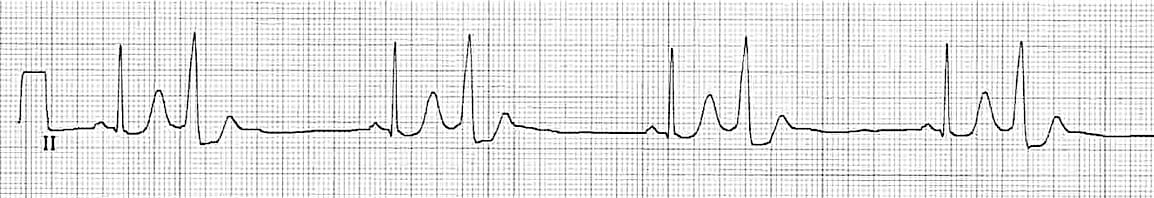
Multifocal atrial rhythm
 Differentiate from ectopic atrial rhythm. In ectopic atrial rhythm, the P-wave morphology remains consistent as the PACs originate from a single ectopic focus. In contrast, multifocal atrial rhythm shows varying P-wave morphologies from beat to beat, reflecting the random discharge of multiple ectopic atrial foci .
Early repolarization
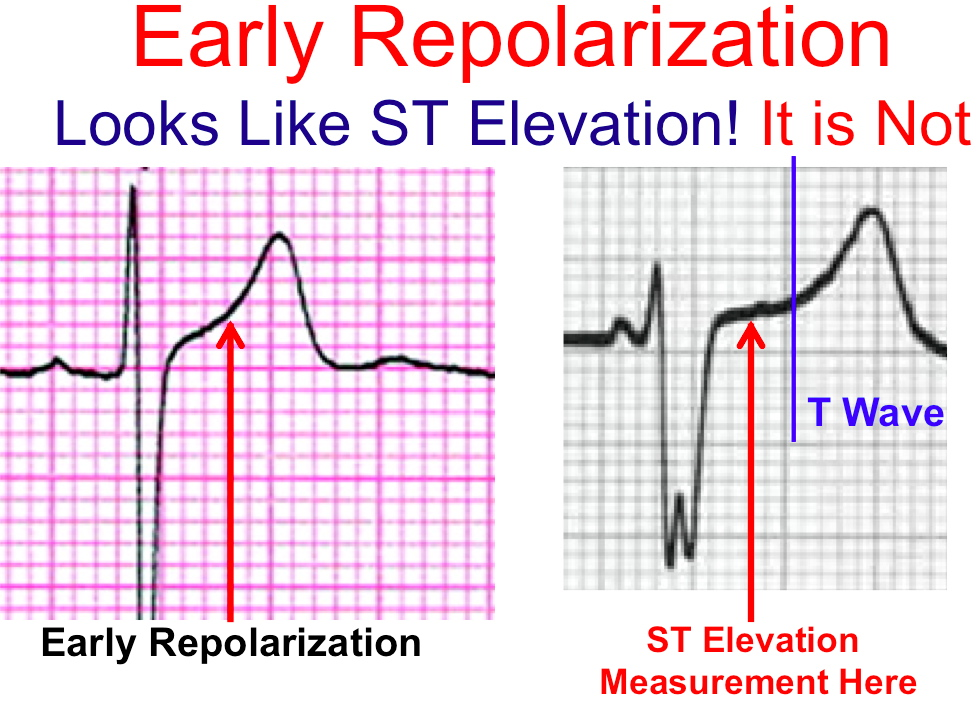 on the LEFT, the T wave repolarization looks like a continuation of the S wave. This is not ST elevation and is seen often in young adults. It is called benign early repolarization. On the right, you clearly see the completion of the S wave and a clear ST Segment which allows you to do an accurate ST Elevation measurement.
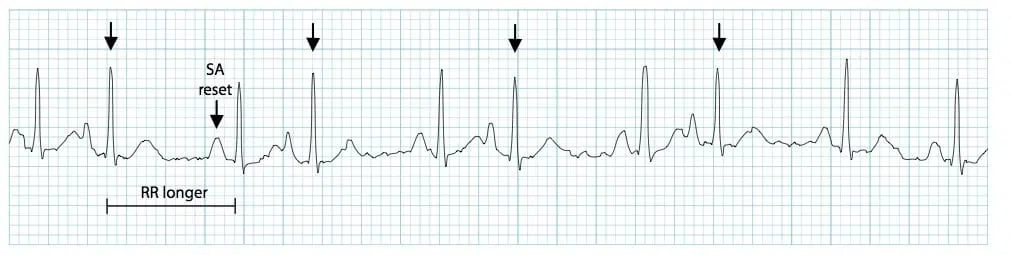
Premature Atrial Complex (PAC)
A premature atrial complex (PAC) is a premature beat arising from ectopic pacemaking tissue within the atria. There is an abnormal P wave, usually followed by a normal QRS complex. AKA: Atrial ectopics, atrial extrasystoles, atrial premature beats, atrial premature depolarisations.
Tip
- Abnormal (non-sinus) P wave usually followed by a normal QRS complex (< 120 ms)
- PACs arising close to the AV node (“low atrial” ectopics) cause retrograde activation of the atria, producing an inverted P wave with a relatively short PR interval ≥ 120 ms (PR interval < 120 ms is classified as a PJC)
- The abnormal P wave may be hidden in the preceding T wave, producing a “peaked” or “camel hump” appearance
- Post-extrasystolic pauses may be present — PACs that reach the SA node may depolarise it, causing the SA node to be “reset”, with a longer-than-normal interval before the next sinus beat arrives
- PACs may also be conducted aberrantly (usually RBBB morphology), or not conducted at all. P waves will still be visible in both cases
Premature Ventricular Complex (PVC)
- Broad QRS complex (≥ 120 ms) with abnormal morphology
- Premature — i.e. occurs earlier than would be expected for the next sinus impulse
- Discordant ST segment and T wave changes.
- ST segment and T wave are directed opposite to the main vector of the QRS complex
- Usually followed by a full compensatory pause
- Retrograde capture of the atria may or may not occur
Junctional Escape Rhythm
- Junctional rhythm with a rate of 40-60 bpm
- QRS complexes are typically narrow (< 120 ms)
- No relationship between the QRS complexes and any preceding atrial activity (e.g. P-waves, flutter waves, fibrillatory waves)
Mechanism
Pacemaker cells are found at various sites throughout the conducting system, with each site capable of independently sustaining the heart rhythm. The rate of spontaneous depolarization of pacemaker cells decreases down the conducting system:
- SA node (60-100 bpm)
- Atria (< 60 bpm)
- AV node (40-60 bpm)
- Ventricles (20-40 bpm) Under normal conditions, subsidiary pacemakers are suppressed by the more rapid impulses from above (i.e. sinus rhythm). Junctional and ventricular escape rhythms arise when the rate of supraventricular impulses arriving at the AV node or ventricle is less than the intrinsic rate of the ectopic pacemaker.
Terminology
- Junctional bradycardia = junctional rhythm at a rate of < 40 bpm
- Junctional escape rhythm = junctional rhythm at a rate of 40-60 bpm
- Accelerated junctional rhythm = junctional rhythm at 60-100 bpm
- Junctional tachycardia = junctional rhythm at > 100 bpm
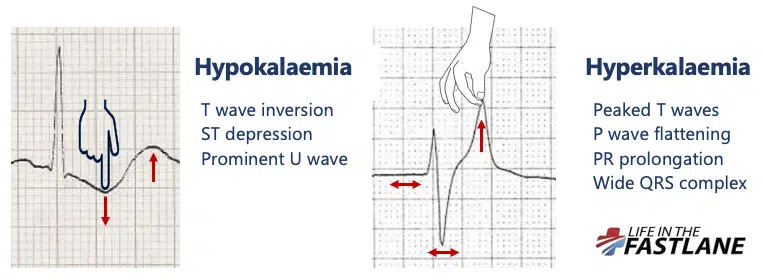
Hyperkalemia
| 高钾血症:三低一高 | 低钾血症:三高一低 |
|---|---|
| 兴奋↑(↓) | 兴奋↑ |
| 传导↓ | 传导↓ |
| 自律↓ | 自律↑ |
| 收缩↓ | 收缩↑(↓) |
- Peaked T Waves (Repolarization issue):
- Increased extracellular increases the conductivity of potassium channels during Phase 3 (Repolarization).
- This causes an accelerated/rapid repolarization, creating the sharp “peak” of the T wave.
- Widened QRS & Loss of P (Depolarization issue):
- High extracellular makes the Resting Membrane Potential (RMP) less negative (partial depolarization).
- This chronic partial depolarization keeps fast channels in an inactivated state.
- Result: Sluggish Phase 0 upstroke (slow conduction velocity) Widened complexes.
Hypokalemia
- Prolonged Repolarization:
- Low extracellular decreases the permeability of potassium channels during Phase 3.
- This delays repolarization, prolonging the Action Potential duration.
- U Wave Formation:
- The mechanism is debated, but theoretically represents the delayed repolarization of the His-Purkinje system or papillary muscles, which are more sensitive to low than the ventricular myocardium.
- Arrhythmogenesis:
- The prolonged repolarization creates heterogeneity (some cells reset, others don’t), allowing for “Early After-Depolarizations” (EADs) triggering Torsades de Pointes.
The push-pull effect
Mnemonic
To remember that low potassium may result in a flattened T wave, think of: “No pot, no tea (T)!”
Tip
Hypokalemia, hypocalcemia and hypomagnesemia all appear to prolong the QT interval, but they do so for different reasons:
- Hypokalemia prolongs the QU interval which can be mistaken for the QT interval
- Hypocalcemia prolongs the ST segment (resulting in a long QT with a normal T wave)
- Hypomagnesemia prolongs the T wave (resulting in a long QT with a long T wave)
Atrioventricular block
Bundle Branch Block
mnemonic: William Marrow
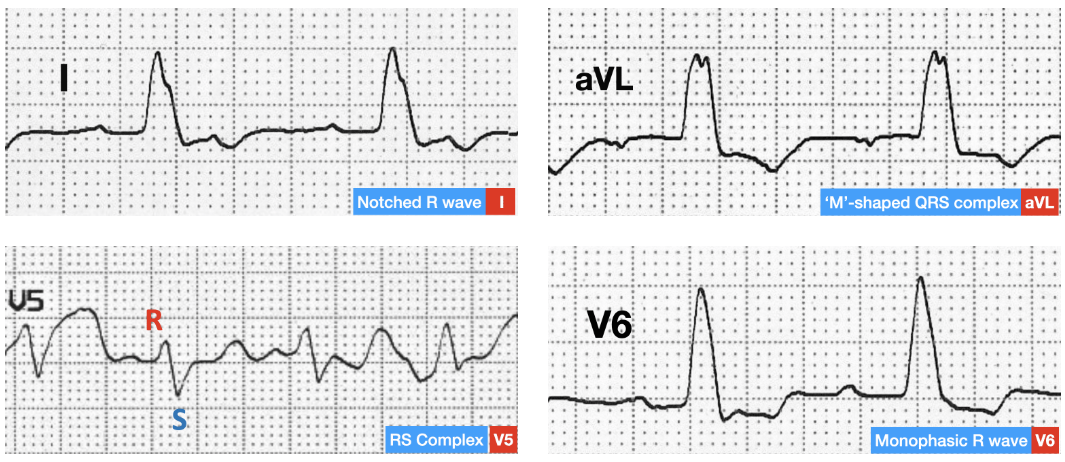
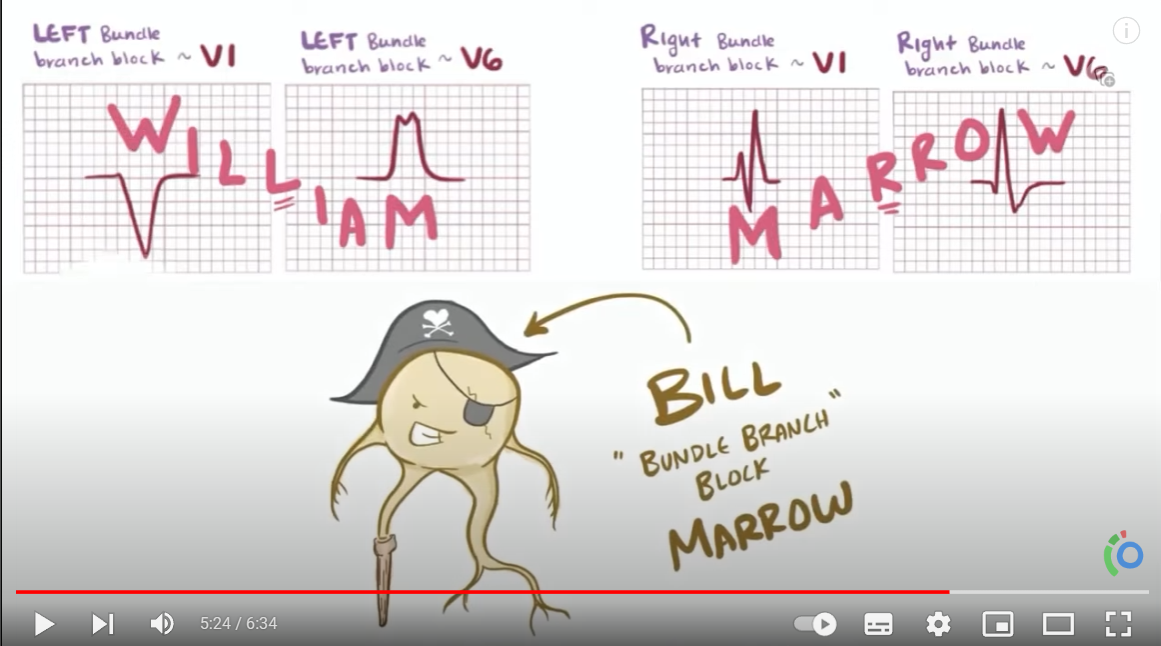 In left bundle branch block
- The R wave in the lateral leads may be either “M-shaped”, notched, monophasic, or an RS complex
 In right bundle branch block, the right precordial leads will show ST-segment depression and T-wave inversion. Similarly, in left bundle branch block, ST-segment depression and T-wave inversion can be seen in the left lateral leads.
Mitral stenosis
Characteristic findings include:
- Left atrial enlargement/P mitrale (widened and biphasic P wave)
- Atrial flutter
- Right ventricular hypertrophy (e.g., right axis deviation, dominant R wave in lead V1)
Accelerated Idioventricular Rhythm
AIVR, also known as Accelerated Ventricular Rhythm, results when the rate of an ectopic ventricular pacemaker exceeds that of the sinus node. Often associated with increased vagal tone and decreased sympathetic tone.
Features
- Regular rhythm
- Rate typically 50-120 bpm
- Three or more ventricular complexes; QRS duration > 120ms
- Fusion and capture beats
Pathophysiology
- Proposed mechanism is enhanced automaticity of ventricular pacemaker, although triggered activity may play a role, particularly in ischemia and digoxin toxicity
- AIVR is classically seen in the reperfusion phase of an acute STEMI, e.g. post thrombolysis
- Usually a well-tolerated, benign, self-limiting arrhythmia
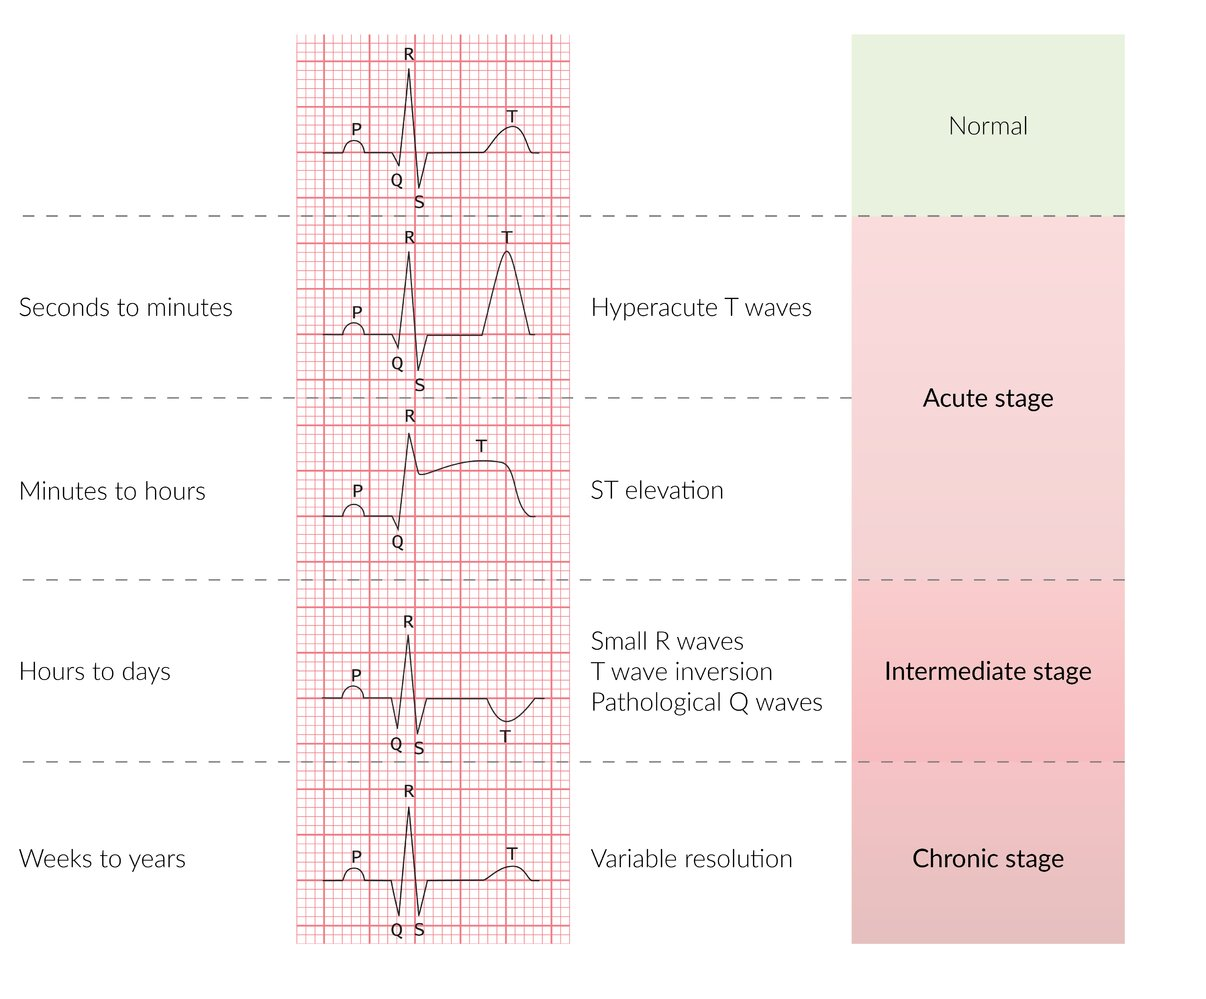
STEMI
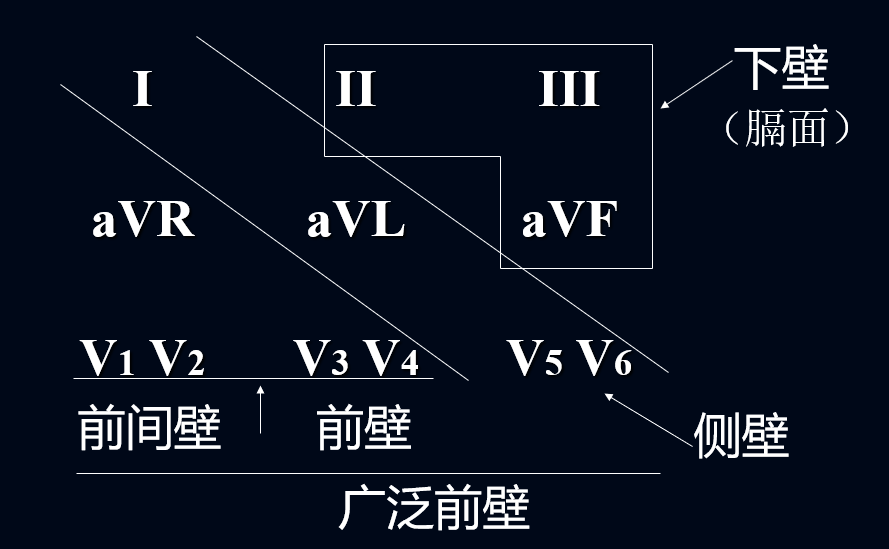
 Timeline of ECG changes in STEMI
The sequence of ECG changes over several hours to days: hyperacute T wave → ST elevation → pathological Q wave → T-wave inversion → ST normalization → T-wave normalization
Timeline of ECG changes in STEMI
The sequence of ECG changes over several hours to days: hyperacute T wave → ST elevation → pathological Q wave → T-wave inversion → ST normalization → T-wave normalization
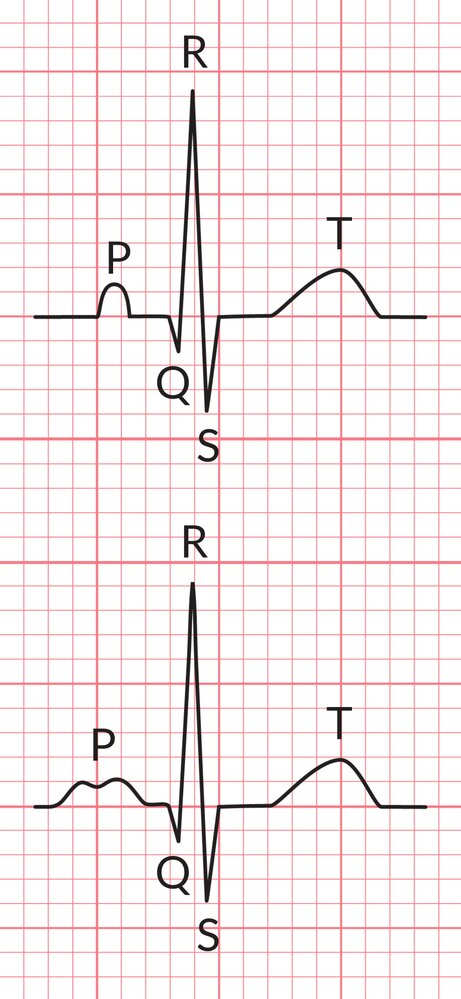
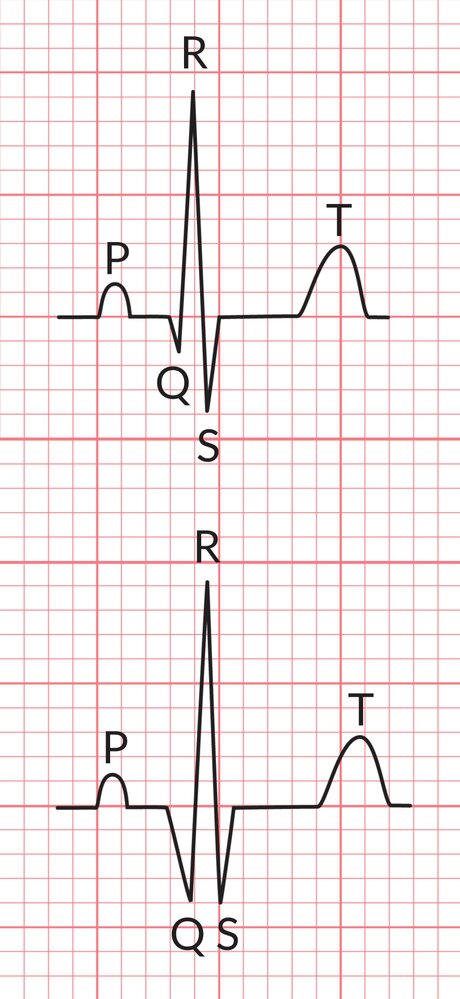
Pathological Q wave
Top: normal Q wave
Bottom: pathological Q wave with a duration ≥0.04 s and depth >¼ of R wave amplitude (red and green overlays)
Ventricular aneurysm
The pattern of persistent anterior ST elevation (> 2 weeks after STEMI) plus pathological Q waves has a sensitivity of 38% and a specificity of 84% for the diagnosis of ventricular aneurysm.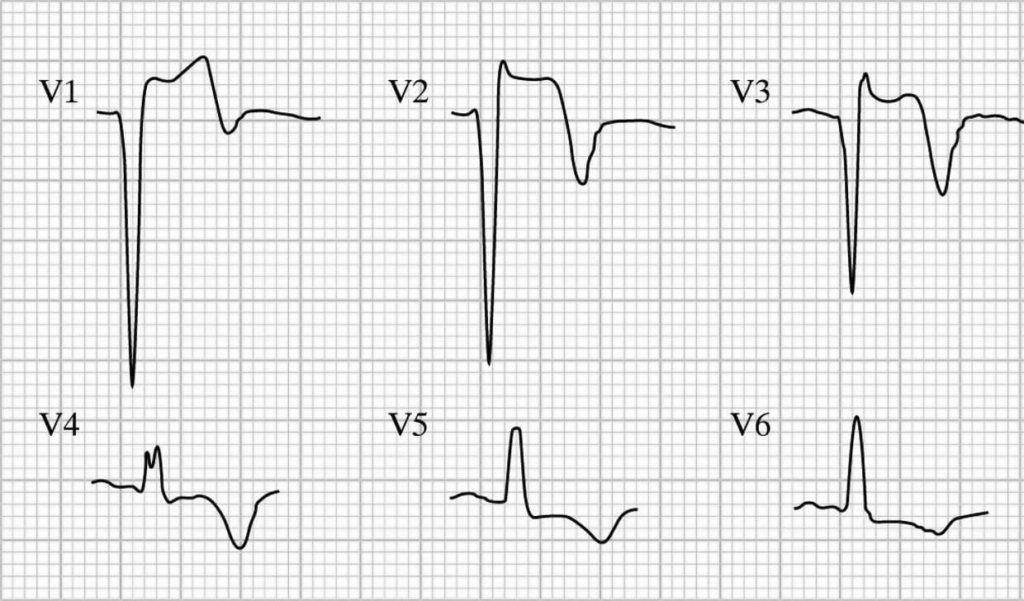
ECG Motion Artefacts
Somatic Tremor (ECG Artifact)
Clinical Presentation
- Appearance: High-frequency, erratic, jagged baseline oscillations.
- Key Feature: QRS complexes are preserved and regular (visible “marching through” the noise).
Causes
- Shivering (Hypothermia), Parkinson’s Disease, Anxiety/Muscle tension.
Differentiation (Crucial Step)
- Tremor vs. V-Fib: Somatic tremor mimics Ventricular Fibrillation.
- Action: Check the patient.
- Patient awake/talking + “V-Fib” on monitor = Artifact.
- Do NOT defibrillate.
- Action: Check the patient.
- Tremor vs. A-Fib: P-wave is present despite tremor. c
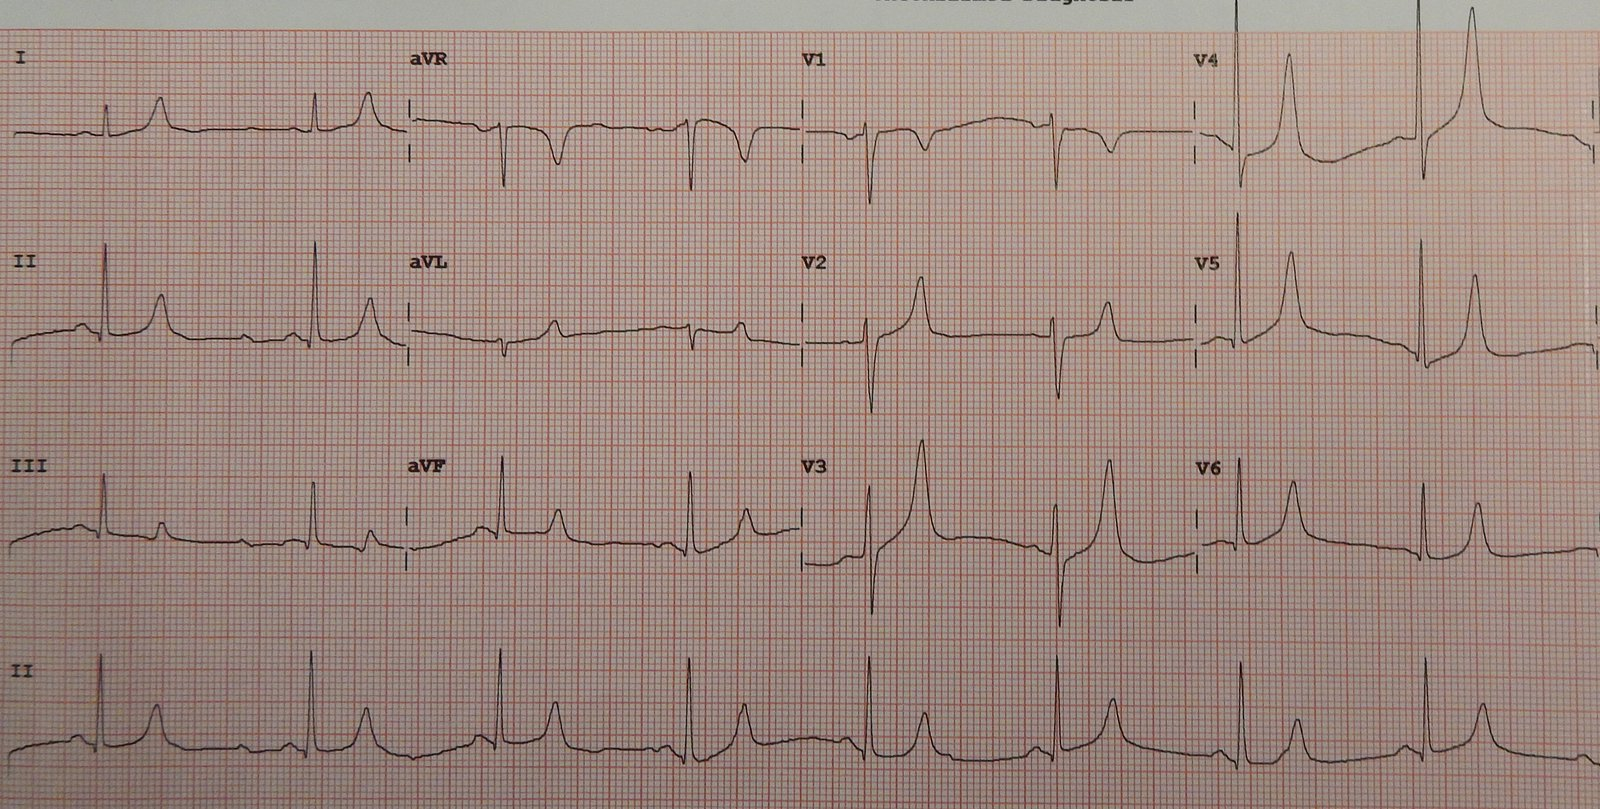
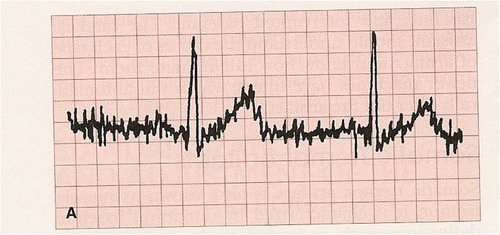
Parkinsonian tremor:
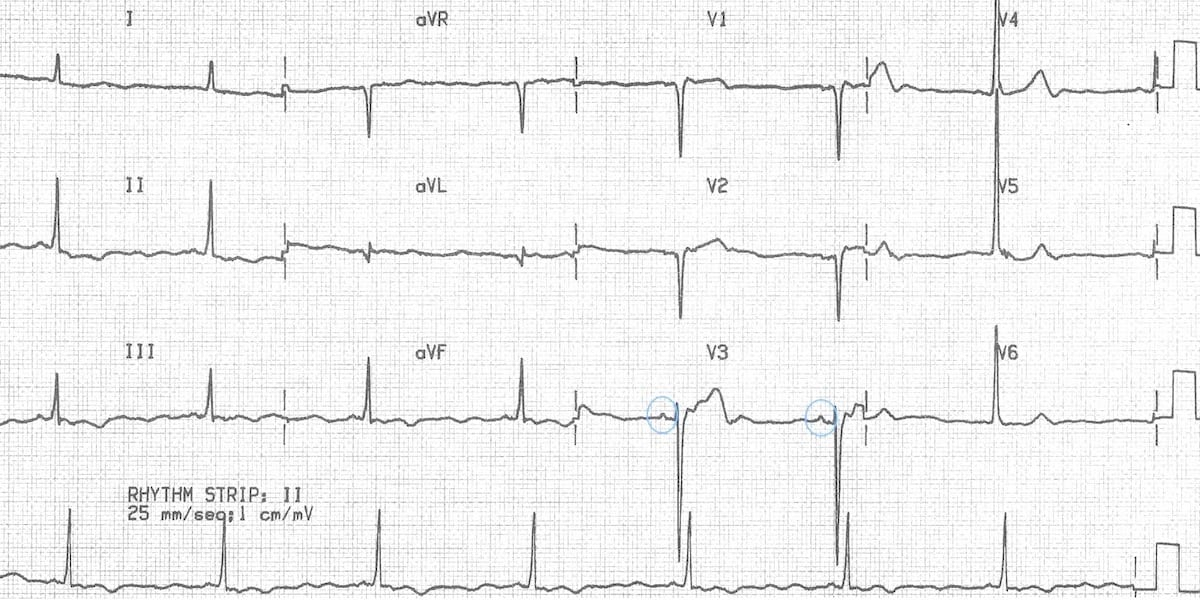
- The irregular baseline in this ECG gives the appearance of atrial fibrillation
- The slow regular rhythm even suggests the possibility of atrial fibrillation with complete heart block and a junctional escape rhythm
- However, on closer inspection there are visible P waves in V3 (circled)
- This patient had sinus bradycardia and a resting tremor due to Parkinson’s disease
Miscellaneous
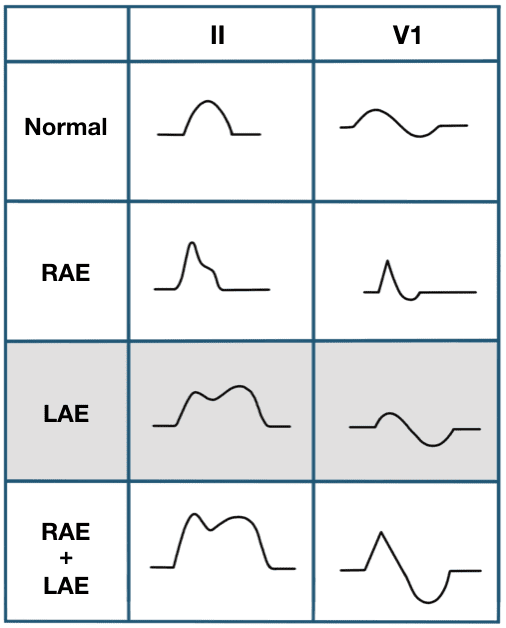
P Wave
- Represents: Atrial depolarization (contraction), initiated by the sinoatrial (SA) node. The first half corresponds to right atrial activation, and the second half to left atrial activation.
- Normal:
- Upright in leads I, II, and aVF; inverted in aVR.
- The P wave in V1 is often biphasic. Early right atrial forces are directed anteriorly, giving rise to an initial positive deflection; these are followed by left atrial forces travelling posteriorly, producing a later negative deflection.
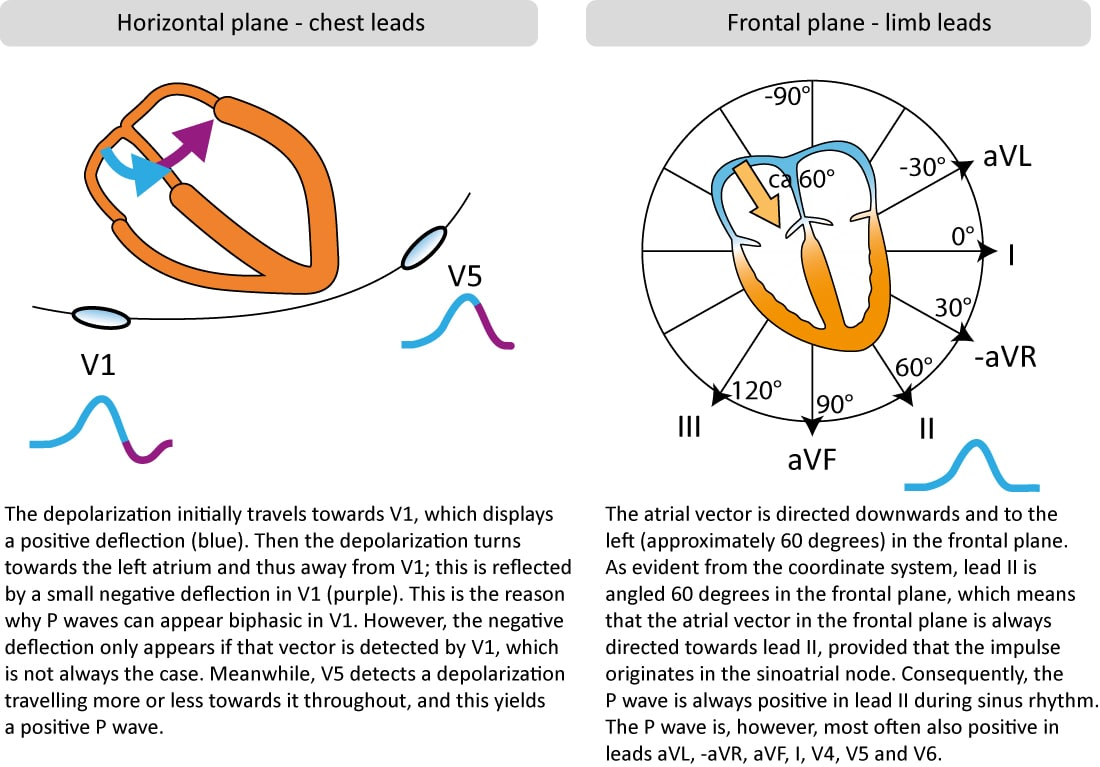
- The P wave in V1 is often biphasic. Early right atrial forces are directed anteriorly, giving rise to an initial positive deflection; these are followed by left atrial forces travelling posteriorly, producing a later negative deflection.
- Duration: <0.12 s (<3 small squares).
- Amplitude: <2.5 mm in limb leads.
- Upright in leads I, II, and aVF; inverted in aVR.
- Abnormalities:
- P mitrale (notched or bifid P wave >0.12s): Suggests left atrial enlargement (e.g., due to mitral stenosis or severe HTN).
- P pulmonale (peaked P wave >2.5mm): Suggests right atrial enlargement (e.g., due to pulmonary HTN or COPD).
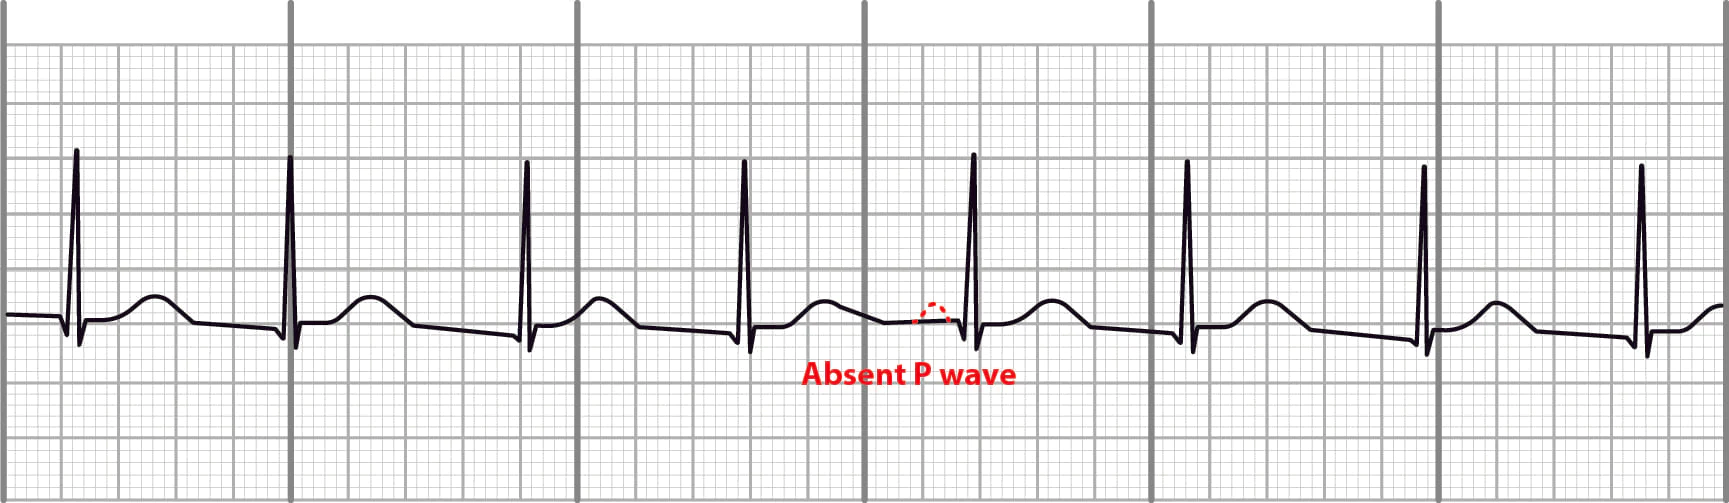
- Absent P waves: May indicate atrial fibrillation, ventricular rhythms, or sinoatrial arrest.
- Inverted P waves: Suggests an ectopic atrial or junctional focus.
PR Interval
- Represents: The time from the start of atrial depolarization to the start of ventricular depolarization. It primarily reflects conduction through the atrioventricular (AV) node.
- Normal:
- Duration: 0.12–0.20 s (3–5 small squares).
- Abnormalities:
- Prolonged PR (>0.20s): First-degree AV block. Causes include increased vagal tone, beta-blockers, calcium channel blockers, and ischemic heart disease.
- Short PR (<0.12s): Suggests a pre-excitation syndrome (e.g., Wolff-Parkinson-White [WPW] syndrome) or a junctional rhythm.
- Variable PR interval: Can indicate second-degree or third-degree AV block.
QRS Complex
- Represents: Ventricular depolarization. Its duration indicates the speed of intraventricular conduction.
- Normal:
- Duration: <0.12 s (typically 0.08-0.10s).
- Q wave: First downward deflection. Normal (“septal”) Q waves are small and seen in lateral leads.
- R wave: First upward deflection.
- S wave: Downward deflection following an R wave.
- Abnormalities:
- Wide QRS (>0.12s): Indicates delayed ventricular conduction. Seen in bundle branch blocks, ventricular hypertrophy, ventricular rhythms (e.g., VTach), and electrolyte abnormalities (e.g., hyperkalemia).
- Pathologic Q waves: Deeper or wider Q waves, suggesting prior myocardial infarction.
- High amplitude: Can suggest ventricular hypertrophy.
ST Segment
- Represents: The isoelectric period between ventricular depolarization and repolarization, corresponding to the plateau phase of the cardiac action potential. The junction between the QRS and ST segment is the J point.
- Normal:
- Generally flat (isoelectric).
- Abnormalities:
- ST Elevation: A hallmark of acute myocardial infarction (transmural ischemia). Other causes include pericarditis, coronary vasospasm (Prinzmetal’s angina), and benign early repolarization.
- ST Depression: Suggests subendocardial ischemia (e.g., in stable angina or NSTEMI), digoxin effect, or ventricular hypertrophy.
T Wave
- Represents: Ventricular repolarization.
- Normal:
- Upright in most leads, except aVR and sometimes V1.
- Typically asymmetrical.
- Abnormalities:
- Peaked T waves: A classic sign of hyperkalemia. Can also be seen in the hyperacute phase of a STEMI.
- Inverted T waves: Can indicate ischemia or infarction. Other causes include bundle branch block, ventricular hypertrophy (“strain” pattern), and CNS events (e.g., intracranial hemorrhage). Wellens syndrome features deep, symmetric T-wave inversions in anterior leads, suggesting critical LAD stenosis.
- Flat T waves: Nonspecific, but can be seen in hypokalemia or ischemia.
U Wave
- Represents: The origin is debated, but thought to be repolarization of the Purkinje fibers or mid-myocardial “M” cells. It is a small, positive deflection that can follow the T wave.
- Normal:
- Small, rounded, and follows the same direction as the T wave.
- Abnormalities:
- Prominent U waves: Classic finding in hypokalemia. Also seen with bradycardia.
- Inverted U waves: A highly specific sign for cardiac pathology, including myocardial ischemia.
Rates
- Atrial flutter: 250-300/min — about 1 small block
- Atrial fibrillation: 350-400/min — less than 1 small block
- Atrial tachycardia, AVNRT: 130-240 — 1-2 small block
- Ventricular tachycardia: >100 — less than 3 small blocks